
Cost of Living Comparison by Country: A Guide for Remote Workers
Table of content
- Why Your Salary Feels Different Abroad
- Your real basket matters more than an online ranking
- Using Price Level Indices for Accurate Country Comparisons
- European Union Cost of Living Differences Across Categories
- Lifestyle choices widen or narrow the gap
- How Housing Distorts Cheap-Country Assumptions
- Building a Resilient Nomad Budget Across Countries
- Create three versions of the same life
- Add shock cases instead of trusting a static ranking
- Choosing the Right Remote-Work Base
- Match the destination to your dominant expenses
- Next Steps for Remote Workers Planning Relocation
Denmark's household price level was 143% of the European Union average in 2024, while Bulgaria's was 60%, making Denmark's measured household consumption level more than twice Bulgaria's. That gap proves why a country ranking alone can't decide where a remote worker should live.
You may discover the problem the first month after landing. The salary that felt comfortable at home suddenly has to cover a furnished rental, deposits, groceries, reliable internet, coworking, insurance, taxes, and flights. A destination that looked cheap in a search result can become expensive once your actual lifestyle replaces the standardized basket behind the ranking.
A useful cost of living comparison countries framework therefore needs two lenses. First, measure structural price differences with purchasing power parities and Price Level Indices. Then test the result against housing, income, currency exposure, inflation, and the way you spend in practice.
Why Your Salary Feels Different Abroad
A remote consultant arrives in Lisbon with the same monthly income that supported a relaxed routine in another country. The first week feels manageable. Then the furnished apartment consumes more cash than expected, restaurant meals add up, and a short-term rental premium leaves less room for travel or savings. The salary hasn't changed, but its purchasing power has.
The same person might experience the opposite effect in a lower-price environment. Local groceries, transport, and services may take a smaller share of income, allowing the worker to maintain a broader lifestyle. A third destination could reverse the result again if accommodation, imported equipment, and international services are expensive.
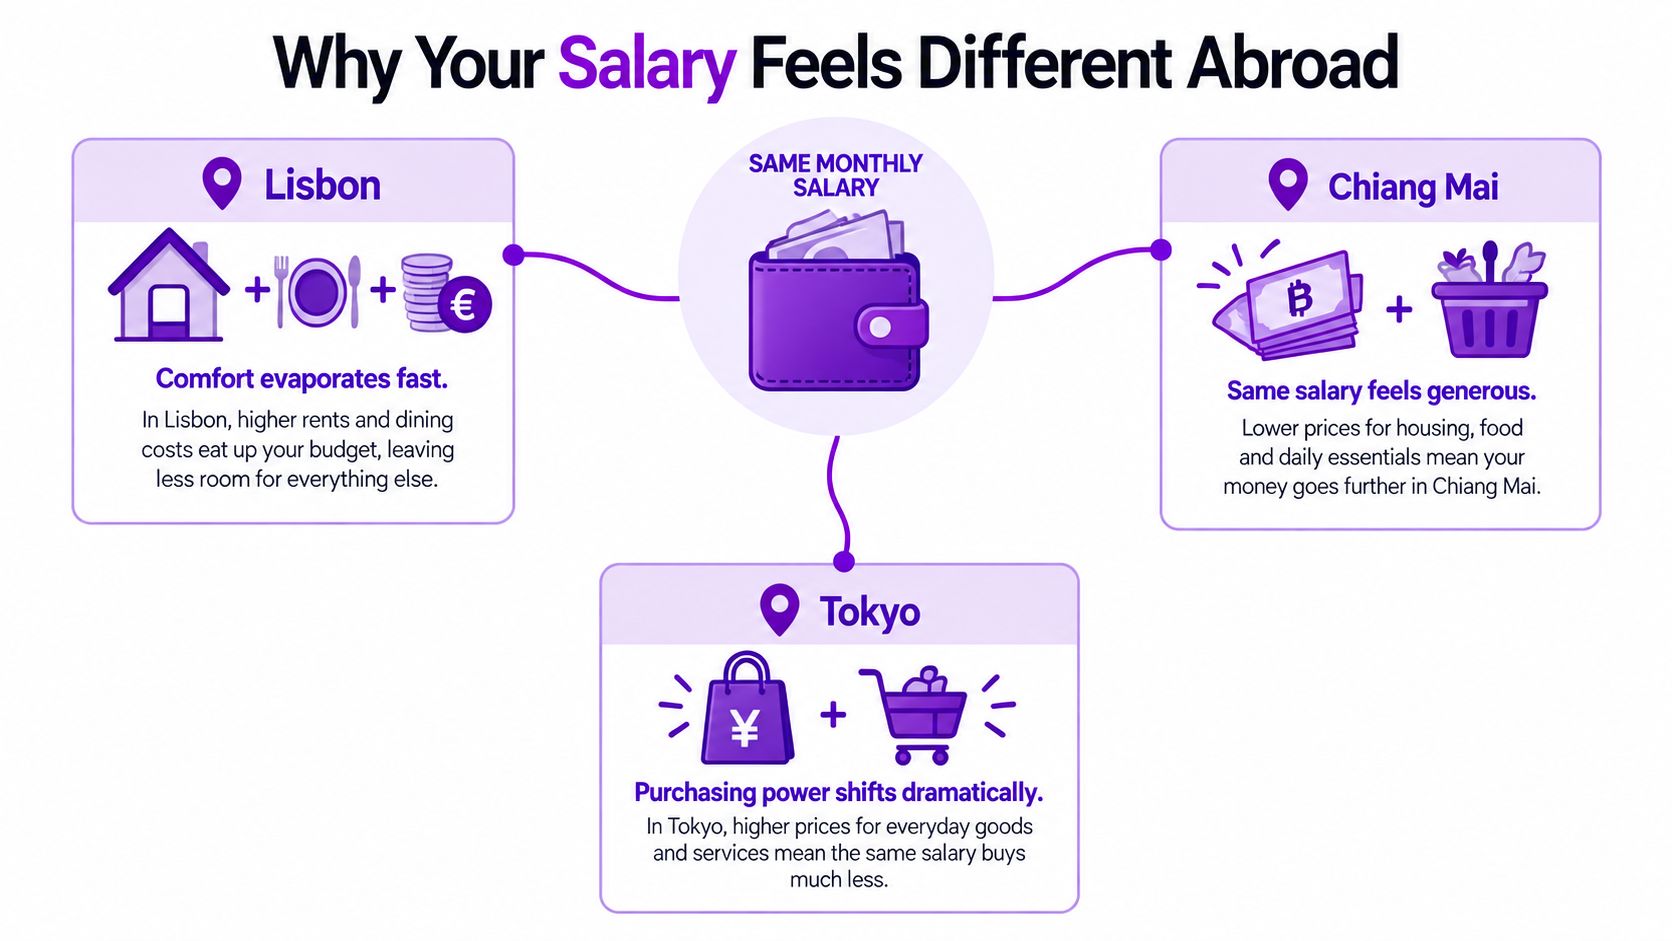
The difference isn't mysterious. Money buys a bundle of local goods and services, and that bundle changes from country to country. A weak currency may make a destination appear affordable to someone paid in euros or dollars, yet domestic rents and utilities may already reflect local inflation. A strong currency can coexist with moderate prices in some categories, but the same currency may also make hospitality or housing costly for newcomers.
Your real basket matters more than an online ranking
A standardized national basket gives you a useful starting point, not a relocation decision. Your basket may include:
- Furnished housing: Short and medium-term rentals often differ from the long leases used in official housing measurements.
- Work infrastructure: Coworking, backup connectivity, equipment, and mobile data can matter more to a freelancer than some household categories.
- Cross-border services: International health insurance, software subscriptions, banking fees, and flights may not move with local prices.
- Lifestyle choices: Eating out, nightlife, fitness, childcare, and imported products can reshape your monthly cash flow.
Practical rule: Treat a country index as a screening tool. Treat your own recurring expenses as the decision model.
Before comparing destinations, calculate net salary rather than relying on a gross offer or headline income. A plain-language guide to net salary from Smart Receipts can help separate money earned from money available after deductions.
The personal question is not just, “Where is life cheapest?” It's whether your income can support your preferred housing, work setup, and travel rhythm without constant account monitoring. That requires a normalized comparison first, followed by a budget built around your own exposure.
Using Price Level Indices for Accurate Country Comparisons
A remote worker paid in one currency and spending in another faces two separate calculations. One is conversion at today's exchange rate. The other is purchasing power, meaning what that converted income can buy once it lands in the local economy.
Purchasing power parities, or PPPs, exist for the second calculation. The World Bank's International Comparison Program methodology compares standardized baskets across economies so GDP and expenditure can be assessed after adjusting for national price levels, rather than through exchange rates alone. That matters because exchange rates move with financial markets, while day-to-day living costs are set inside local markets.
The operational measure for country screening is the Price Level Index, or PLI. Eurostat's definition is simple: PPP divided by the nominal exchange rate, multiplied by 100. For a remote worker, the reading is practical.
| PLI | Practical meaning |
|---|---|
| 100 | The basket costs the same as in the reference economy |
| 80 | The price level is roughly 20% lower |
| 120 | The price level is approximately 20% higher |
A PLI is a relative price signal, not a monthly budget. Your card is charged at market rates, your rent may be repriced faster than national averages, and your savings remain exposed to currency swings. So the right use of PLI is triage. It helps narrow a country list before you test the items that dominate your own cash flow.
That screening is strongest when you start broad and then isolate the categories that break the average. The World Bank's overview of PPPs and purchasing-power analysis distinguishes economy-wide consumption comparisons from narrower category measures. Use household final consumption first, because it captures normal spending better than a viral ranking built on a few visible prices.
Then stress-test the blind spot. Housing often sits outside the neat story told by an overall country index, especially for people who need furnished, flexible accommodation rather than local long-lease terms. Add food, restaurants, transport, communications, and any recurring health or education costs only after that. This sequence avoids a common mistake: concluding that a country is cheap because the national basket is cheap, even when the part of the basket you buy is not.
One more filter improves the comparison. Price level structure and price momentum are different things. The World Bank-hosted OECD price-level material notes that average consumer-price levels across OECD economies were 32.7% higher in March 2025 than in December 2019, while year-on-year inflation had slowed to 4.2% in March 2025. A country can still look affordable on a structural index while becoming harder to live in month by month. For an initial screen, a country cost-of-living comparison tool is useful. After that, replace the average basket with your real rent, work setup, and payment exposure.
European Union Cost of Living Differences Across Categories
A country's overall position can conceal the spending pattern that creates your personal result. Eurostat's 2024 household final consumption comparison placed Denmark at 143% of the EU average, Ireland at 138%, and Luxembourg at 133%. Bulgaria stood at 60%, Romania at 64%, and Poland at 72% of the EU average, according to Eurostat's European price comparison.
| Country | Overall household price level | Restaurants and hotels | Food and non-alcoholic beverages |
|---|---|---|---|
| Denmark | 143% | 148% | Not specified in the comparison |
| Ireland | 138% | Not specified in the comparison | Not specified in the comparison |
| Luxembourg | 133% | Not specified in the comparison | 125% |
| Poland | 72% | Not specified in the comparison | Not specified in the comparison |
| Romania | 64% | 69% | 76% |
| Bulgaria | 60% | 53% | Not specified in the comparison |
The table changes how you should read an affordability ranking. Bulgaria's overall level is far below Denmark's, but the relevant gap depends on what you buy. Restaurants and hotels reached 148% of the EU average in Denmark, compared with 53% in Bulgaria. A remote worker who eats out frequently will feel that difference much more sharply than someone who cooks locally and spends little on hospitality.
Lifestyle choices widen or narrow the gap
Alcohol and tobacco show another category-specific divergence. Ireland reached 205% of the EU average, while Bulgaria was at 69%, so that category was nearly three times as expensive in Ireland as in Bulgaria.
Food also creates a different comparison. Romania recorded 76% of the EU average for food and non-alcoholic beverages, while Luxembourg reached 125%. A worker who cooks mainly with local products may benefit from that difference, but an imported-food routine can weaken the apparent advantage.
Consumer electronics are less predictable. The comparison placed Italy at 89% of the EU average and Finland at 115%, a narrower spread than the overall household figures between the highest and lowest countries.
The cheapest country for your lifestyle is the one that is inexpensive in the categories you repeat every week, not the one with the lowest headline index.
This is why a freelancer should classify spending before comparing destinations. A restaurant-heavy routine points toward one result. A frugal routine built around local food may point toward another. Electronics, software, flights, and international insurance can remain relatively detached from local household prices, so they belong in a separate cash-flow layer rather than being inferred from the national ranking.
How Housing Distorts Cheap-Country Assumptions
A remote worker can move from a high-cost country to a place that looks cheap on paper, then discover that the monthly budget still feels tight by the second rent payment. The gap usually sits in housing. Country comparisons often average together homeowners, long-term tenants, and multiple income groups, while a nomad is more likely to be shopping for a furnished apartment, for a short stay, in a neighborhood with strong demand from visitors or foreign earners.
That mismatch matters because housing is the category most likely to break the logic of a low headline cost index. Food and transport can be cheaper than the European or OECD norm, yet the savings disappear if rent is priced in a separate market from local everyday spending.
The pressure is visible in the broader evidence. According to the OECD affordable housing data, low-income tenants across the OECD spend more than 40% of disposable income on rent, on average, across the OECD. In Colombia, Chile, Costa Rica, Spain, and the United States, more than half of low-income tenant households were housing-cost overburdened. Those figures describe pressure among residents, not nomads specifically, but they show how quickly housing can overpower an otherwise affordable basket.
Canada provides a useful contrast. Housing absorbed 19.3% of median disposable income in 2022, yet low-income households spent 31% on mortgages and 36% on rent, compared with OECD averages of 27% and 33%, respectively, in the same OECD evidence. A national average can therefore look manageable while renters face a much harsher cash-flow reality.
For remote workers, the distortion is often larger because the relevant product is not standard local housing. It is a furnished, flexible rental with utilities included, lower commitment, and higher repricing risk. That is a different market. It can track tourism, seasonality, and expat demand more closely than local wages or national price indices.
Use a separate housing test before calling any country affordable:
- Rental format: Compare local leases, furnished monthly rentals, coliving, and short-stay units separately.
- Income burden: Calculate rent as a share of take-home income.
- Full occupancy cost: Add deposits, utilities, insurance, furnishing gaps, and seasonal repricing.
- Neighborhood selection: Price the districts where you can realistically live and work.
A cheaper country only stays cheap if your housing arrangement matches the assumptions behind the comparison. Ask which destination remains affordable for your income, housing type, and length of stay. Food and transport rankings alone often produce the wrong answer.
Building a Resilient Nomad Budget Across Countries
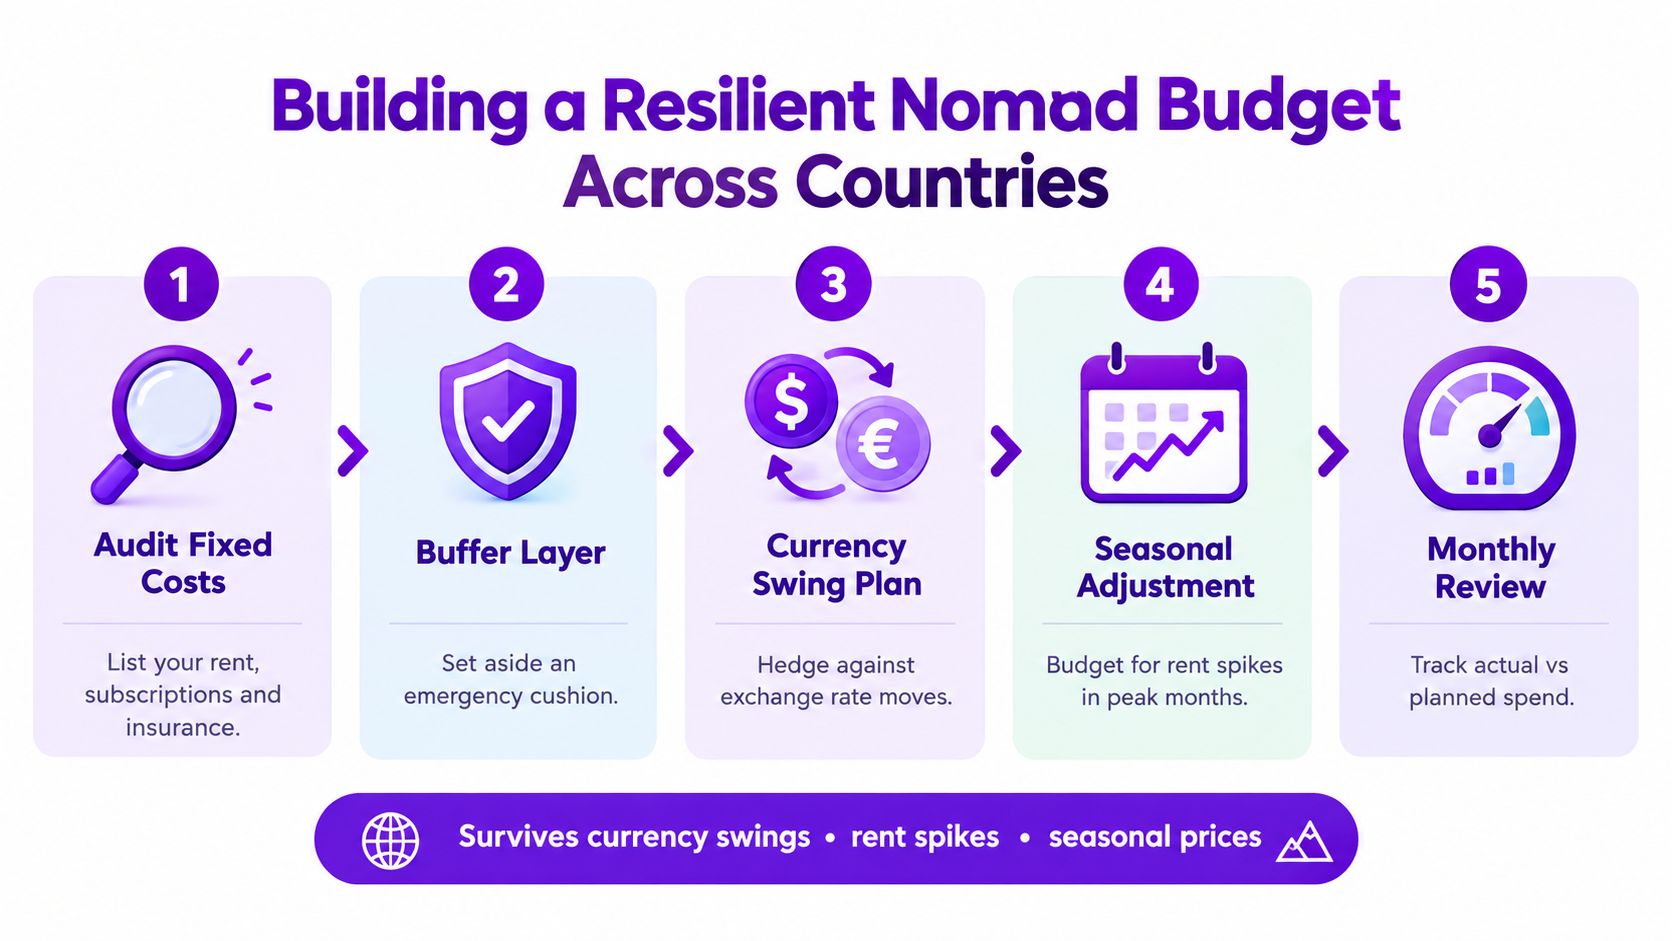
A resilient budget separates what is structurally expensive from what can change during your stay. Use the PLI to screen the base price environment, then build a cash-flow model that shows how rent, exchange rates, and inflation could affect the next several months.
Create three versions of the same life
Local-frugal describes a deliberate low-cost routine. It might rely on local food, public transport, modest housing, and limited paid services. This scenario is useful for testing whether a destination remains viable if you adapt your habits.
Nomad-standard represents the life you can realistically sustain. Include furnished housing, dependable internet, occasional coworking, restaurants, local transport, insurance, and ordinary travel.
Business-operating adds the costs required to protect income. Include better connectivity, coworking or meeting space, software, professional services, equipment replacement, client travel, and banking friction.
Each version should show fixed costs separately from flexible spending. That makes it easier to identify whether a budget fails because of rent or because discretionary choices accumulate.
Add shock cases instead of trusting a static ranking
The OECD evidence cited earlier shows why current inflation and the accumulated price base must be treated separately. Use a base case for current expenses, a high-inflation case for repricing risk, and a separate exchange-rate case for currency depreciation. Don't combine every risk into one opaque adjustment. You need to know which variable is threatening the plan.
A practical monthly review compares planned and actual spending, updates the rental assumption, and records the currency used for each major payment. For cross-border spending, you can also compare non-custodial spending cards as part of a wider banking and payment review, without treating any card as protection against exchange-rate risk.
A moderately expensive destination with stable housing and predictable services can produce a lower effective cost than a cheaper destination where rent changes rapidly and currency movements disrupt every payment. The useful output isn't a permanent ranking. It's a range of monthly outcomes and a clear threshold at which you would leave, renegotiate, or reduce spending.
Resources on the digital nomad lifestyle can complement that model, but your spreadsheet should remain grounded in your own income, obligations, and tolerance for disruption.
Choosing the Right Remote-Work Base
A remote worker paid in dollars can feel financially secure in one country and exposed in another, even when both look affordable in a headline ranking. The better base is usually the place where income timing, rental terms, work setup, and day-to-day administration fit together without putting cash flow under pressure.
That is why country comparisons need two lenses. A Price Level Index is useful for showing how expensive a country is relative to others across a standard basket of goods and services. It gives you a disciplined starting point. But it does not solve the problem on its own, because remote workers do not consume the standard basket in standard proportions, and housing often sits outside the neat picture that national averages suggest.
A salaried employee with stable monthly pay may accept a higher PLI in exchange for reliable infrastructure, predictable services, and less disruption. A freelancer with uneven invoicing needs a wider gap between take-home income and fixed costs. A founder may choose a pricier base if stronger connectivity, better meeting options, and easier client access protect revenue.
Match the destination to your dominant expenses
Start with the category that can break the budget.
If rent is the largest line, compare the furnished housing market before comparing supermarket prices. If childcare or healthcare creates the main constraint, evaluate those directly instead of letting a national average stand in for them. If your work depends on frequent flights, airport access and travel cost can matter more than local restaurant prices.
Stay length changes the calculation. A one-month move often means furnished listings, deposits, and limited bargaining power. A longer stay can improve rent economics, but it may also bring lease obligations, paperwork, tax exposure, or other administrative costs. A country that works well for a trial period can become inefficient once the stay extends.
A practical decision process looks like this:
- Define the income base. Map the payment currency, timing, tax obligations, and volatility of earnings.
- Choose the housing format first. Compare the rental setup you will use, not a national average you cannot access.
- Rank the high-impact categories. Weight food, transport, connectivity, health, and travel by their real importance to your work and life.
- Check operating conditions. Review visa rules, banking access, insurance, internet reliability, and client time zones.
- Stress-test the setup. See whether the location still works when rent tightens or income arrives unevenly.
A lower published price level matters only if it holds up under the way you actually live and earn. In practice, a moderately priced country with stable housing and dependable services can leave you with more usable surplus than a nominally cheaper one that keeps generating friction, delays, and costly surprises.
Next Steps for Remote Workers Planning Relocation
Turn the comparison into a departure checklist before booking a long stay. Start with legality, then validate the financial model, then prepare the systems that keep income moving.
Filter visa requirements first. Use the Mazurly travel visa requirements finder to identify destinations that fit your nationality, intended stay, and remote-work situation. A low-cost country isn't a practical option if your legal stay doesn't match your plan.
Validate the housing assumption. Compare the exact rental format you expect to use. Request the full payment schedule, including deposits, utilities, cleaning, insurance, and any seasonal changes. Keep the national PLI as context, not as a substitute for a real listing.
Build the connectivity layer. Check eSIM availability, local network coverage, backup options, and whether your accommodation provides reliable working conditions. Your budget should include the cost of staying online when the primary connection fails.
Separate personal and business cash flow. Map payment currencies, conversion fees, tax reserves, insurance, subscriptions, and emergency access to funds. Keep a market-exchange-rate view alongside your PPP-adjusted comparison because your bank balance moves at market rates.
Prepare invoicing before departure. Confirm that clients can pay you across borders, that invoice details match your tax position, and that you can track outstanding balances across time zones. A free invoice workflow can prevent a low-cost relocation from creating avoidable administrative delays.
Run a trial period. Spend enough time in the destination to test rental reality, connectivity, transport, and working hours before making an irreversible commitment. Review actual spending against the three budget scenarios and update the assumptions that proved weakest.
A sound relocation decision combines normalized price data with the practical mechanics of renting, working, paying tax, and receiving income. The destination should still make sense after you remove the optimistic assumptions.
Mazurly brings cost-of-living comparisons together with visa research, connectivity planning, banking guidance, invoicing tools, and resources for digital nomads. Use Mazurly to turn a country shortlist into a practical relocation plan built around your real expenses and work requirements.